The Client
Online art market place 🖼️
Knack is an art market place start up with the goal of creating an online market place to engage artists handmade arts and crafts and buyers all together. Uniquely focusing their aim on the online marketplace, Knack is data-driven, P2P business allowing buyers to discover new art based on preferences, unique algorithms, and is completely free.
The Challenge
“How can we mine user data so we can learn more about them to build campaigns for them?”
Knacks key challenge 🔑
During project kick off, my product manager sat me down in a virtual meeting and presented our new deliverable; how can we mine user data so we can learn more about them to help build campaigns around it? With an idea in mind of what our product owner wanted. He had given me a list of adjectives on things about how art would make you feel, so we could best learn more about our new and current users.
Research & Planning
Building off old data
During the ideation phase, I worked along side our UX researcher that handed off a-lot of valuable content regarding past research and customer data. Because Knack was going through a transition ( formerly Help art) a-lot of the data was old, and had room to experiment as Help art was transition in to Knack It.
Style guide 🎨
During the research phase, the style guide was given to me from the project owner credited from the previous designer. Following the style guidelines were very important to my client and I because of consistently throughout the whole design.
Wireframe
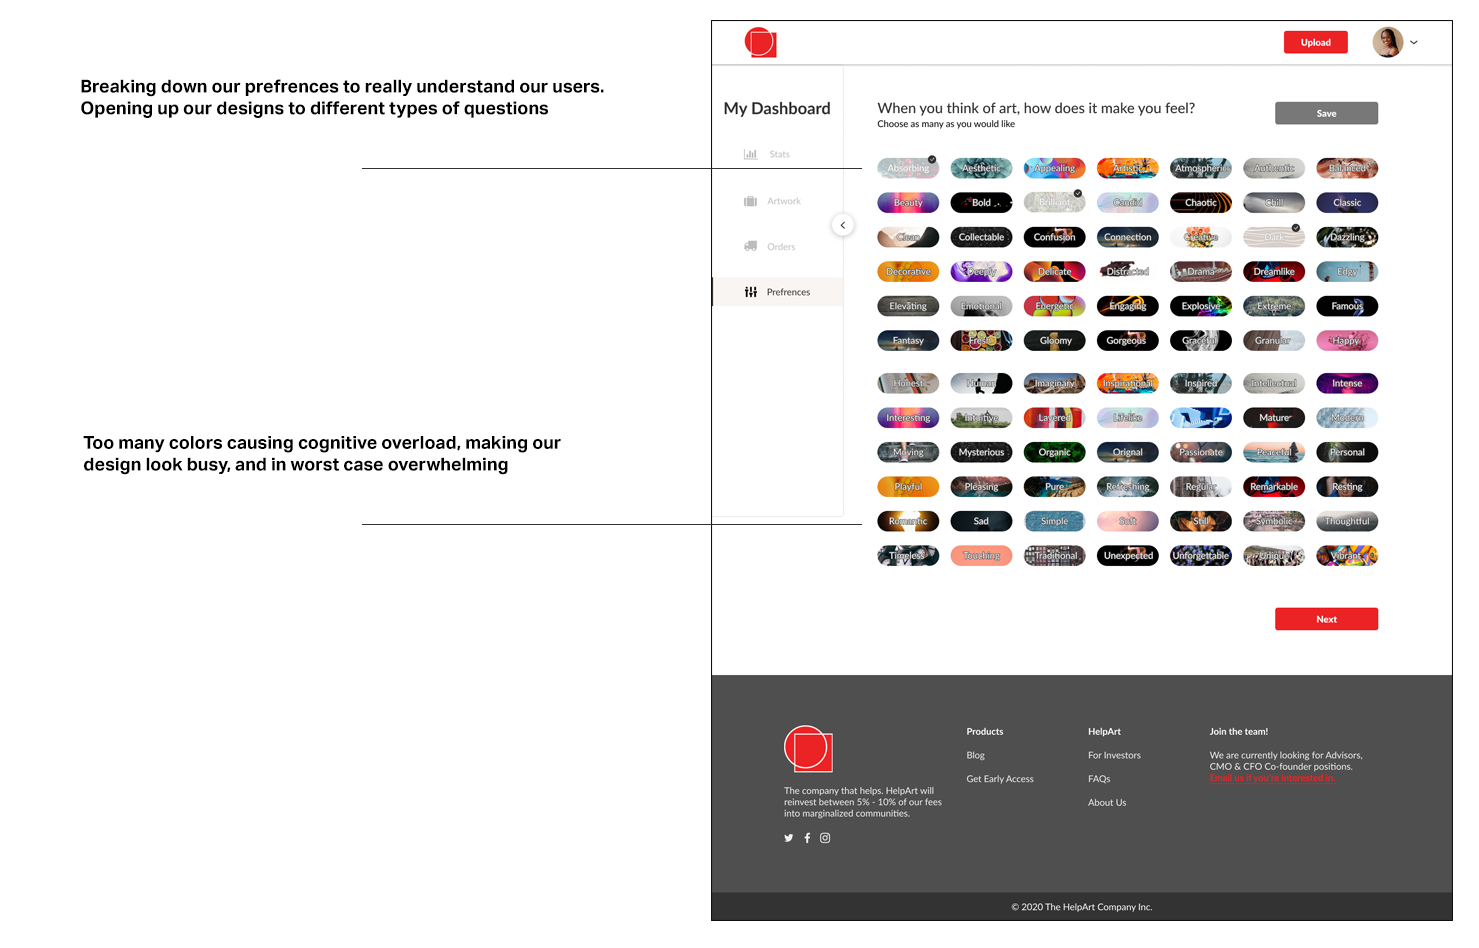
How does art make you feel?
During the first version of the wireframe, we started off with the question of “ how does art make you feel?” and started building from that. This was the initial strategy of mining data from our users on how we can see how we can best understand our users.
Iteration
Beefing up the current design
Changed to smaller circles, added more questions on how art makes you feel, for every one highlighted changed the opacity
Iteration 2
Lets get personal
During the 2nd iteration, I changed the entire design adding more questions centered around who our users our and what preferences they like. This technique was used because we wanted to mine the user preferences data in order to create campaigns and market stratagies.
Final design
Measuring success
Circling back to this project after deployment, I met with project owner and asked to him about what our top variables were most valuable, and found out given the users who filled out the preference questionnaire.
Price variable
Out of 140 users
74 of them chose the range of $100 - $500
While 38 of them chose $500 - $1000
31 of those users choose over $1000 - $10,000
Art variable
97 out of 143 users choose the prints over the originals
80/ 143 users choose to rent of purchase
Using this metric we added this to the home page making it easier for our users to quickly identify how they can shop to increase revenue and sales.
Takeaways
Improve moving forward
More time interacting with the product
What we did well
Incorporating design principles
Executing design within 2 week sprint
Freestyling design


